Maps of child care centers and family child care homes help ensure that first-responders and emergency personnel in your community know where children are in a disaster. Using Geographic Information Systems (GIS), CCAoA is able to use maps and data analysis to understand the economic landscape that child care centers are located in, analyze accessibility of child care resources, and determine child care deserts. This work is powered by Esri’s ArcGIS software, which allows us to visualize our data, including NDS data, survey data, and population statistics from the Census Bureau. With this software, we can show spatial relationships and disparities to bring to policymakers, advocates, and other members of the Child Care community to continue towards our mission of a high quality, affordable health care system. Furthermore, utilizing specific maps, we provide Child Care Resource and Referral (CCR&Rs) agencies with valuable information to aid their process of pairing providers to children and families, based on their unique needs.
Maps
Arkansas after 7 pm Map
Arkansas Tornadoes 2010 2015 Map
Oklahoma Earthquakes Map
Hurricane Matthew Path Map
Monticello Power Plant Map
Red River Moorhead and Fargo Map
Arkansas after 7 p.m.
There are 2,297 Child Care Providers in Arkansas. This map highlights all of Arkansas’ child care facilities that are open after 7 pm (orange dots), child care facilities that are closed after 7 pm (blue dots). Using the slider, users can adjust their view of facilities open before and after 7 pm across the state.
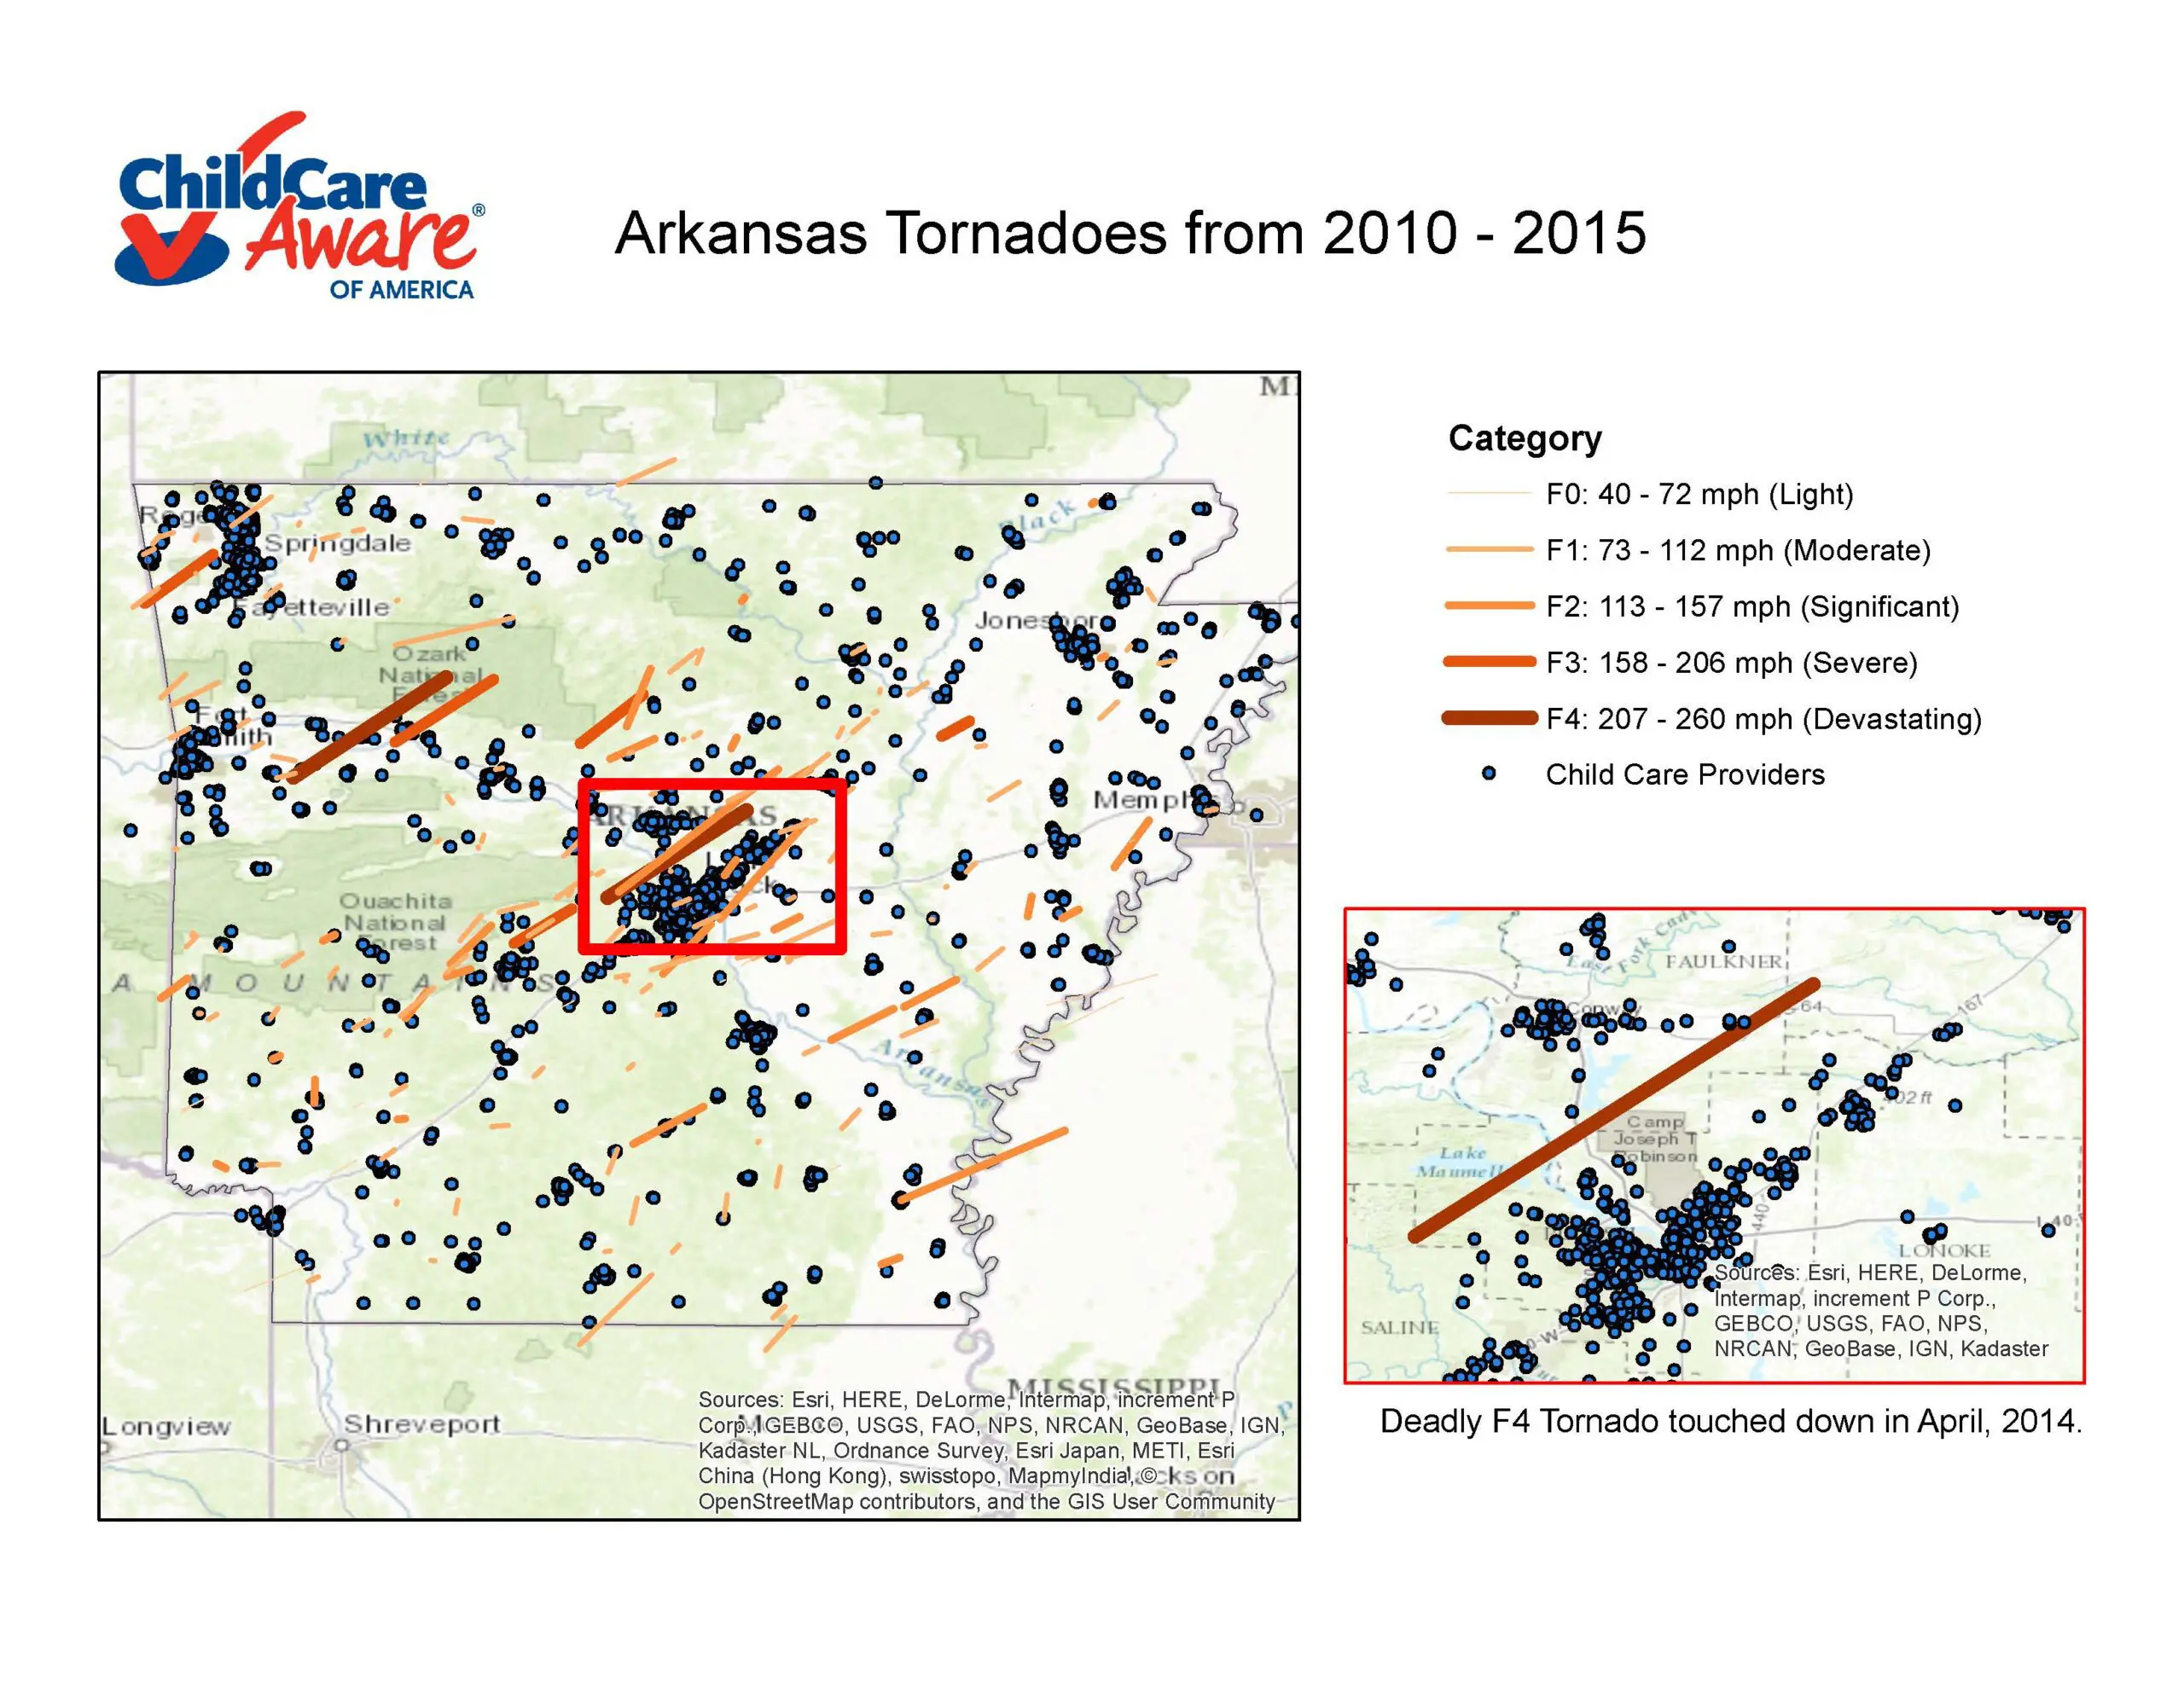
Arkansas Tornadoes 2010-2015
Highlighted are the various tornado paths (orange lines; categorized from light, thin and light shading, to devastating, thick and dark shading) that have impacted Arkansas from 2010-2015 and the Child Care Providers (blue dots) in the state.
Oklahoma Earthquakes
The map highlights all of the child care facilities (orange dots) in Oklahoma and the seismic activity (purple blue-ish shading; purple is higher frequency and strength, blue is lower frequency and strength) in the area.
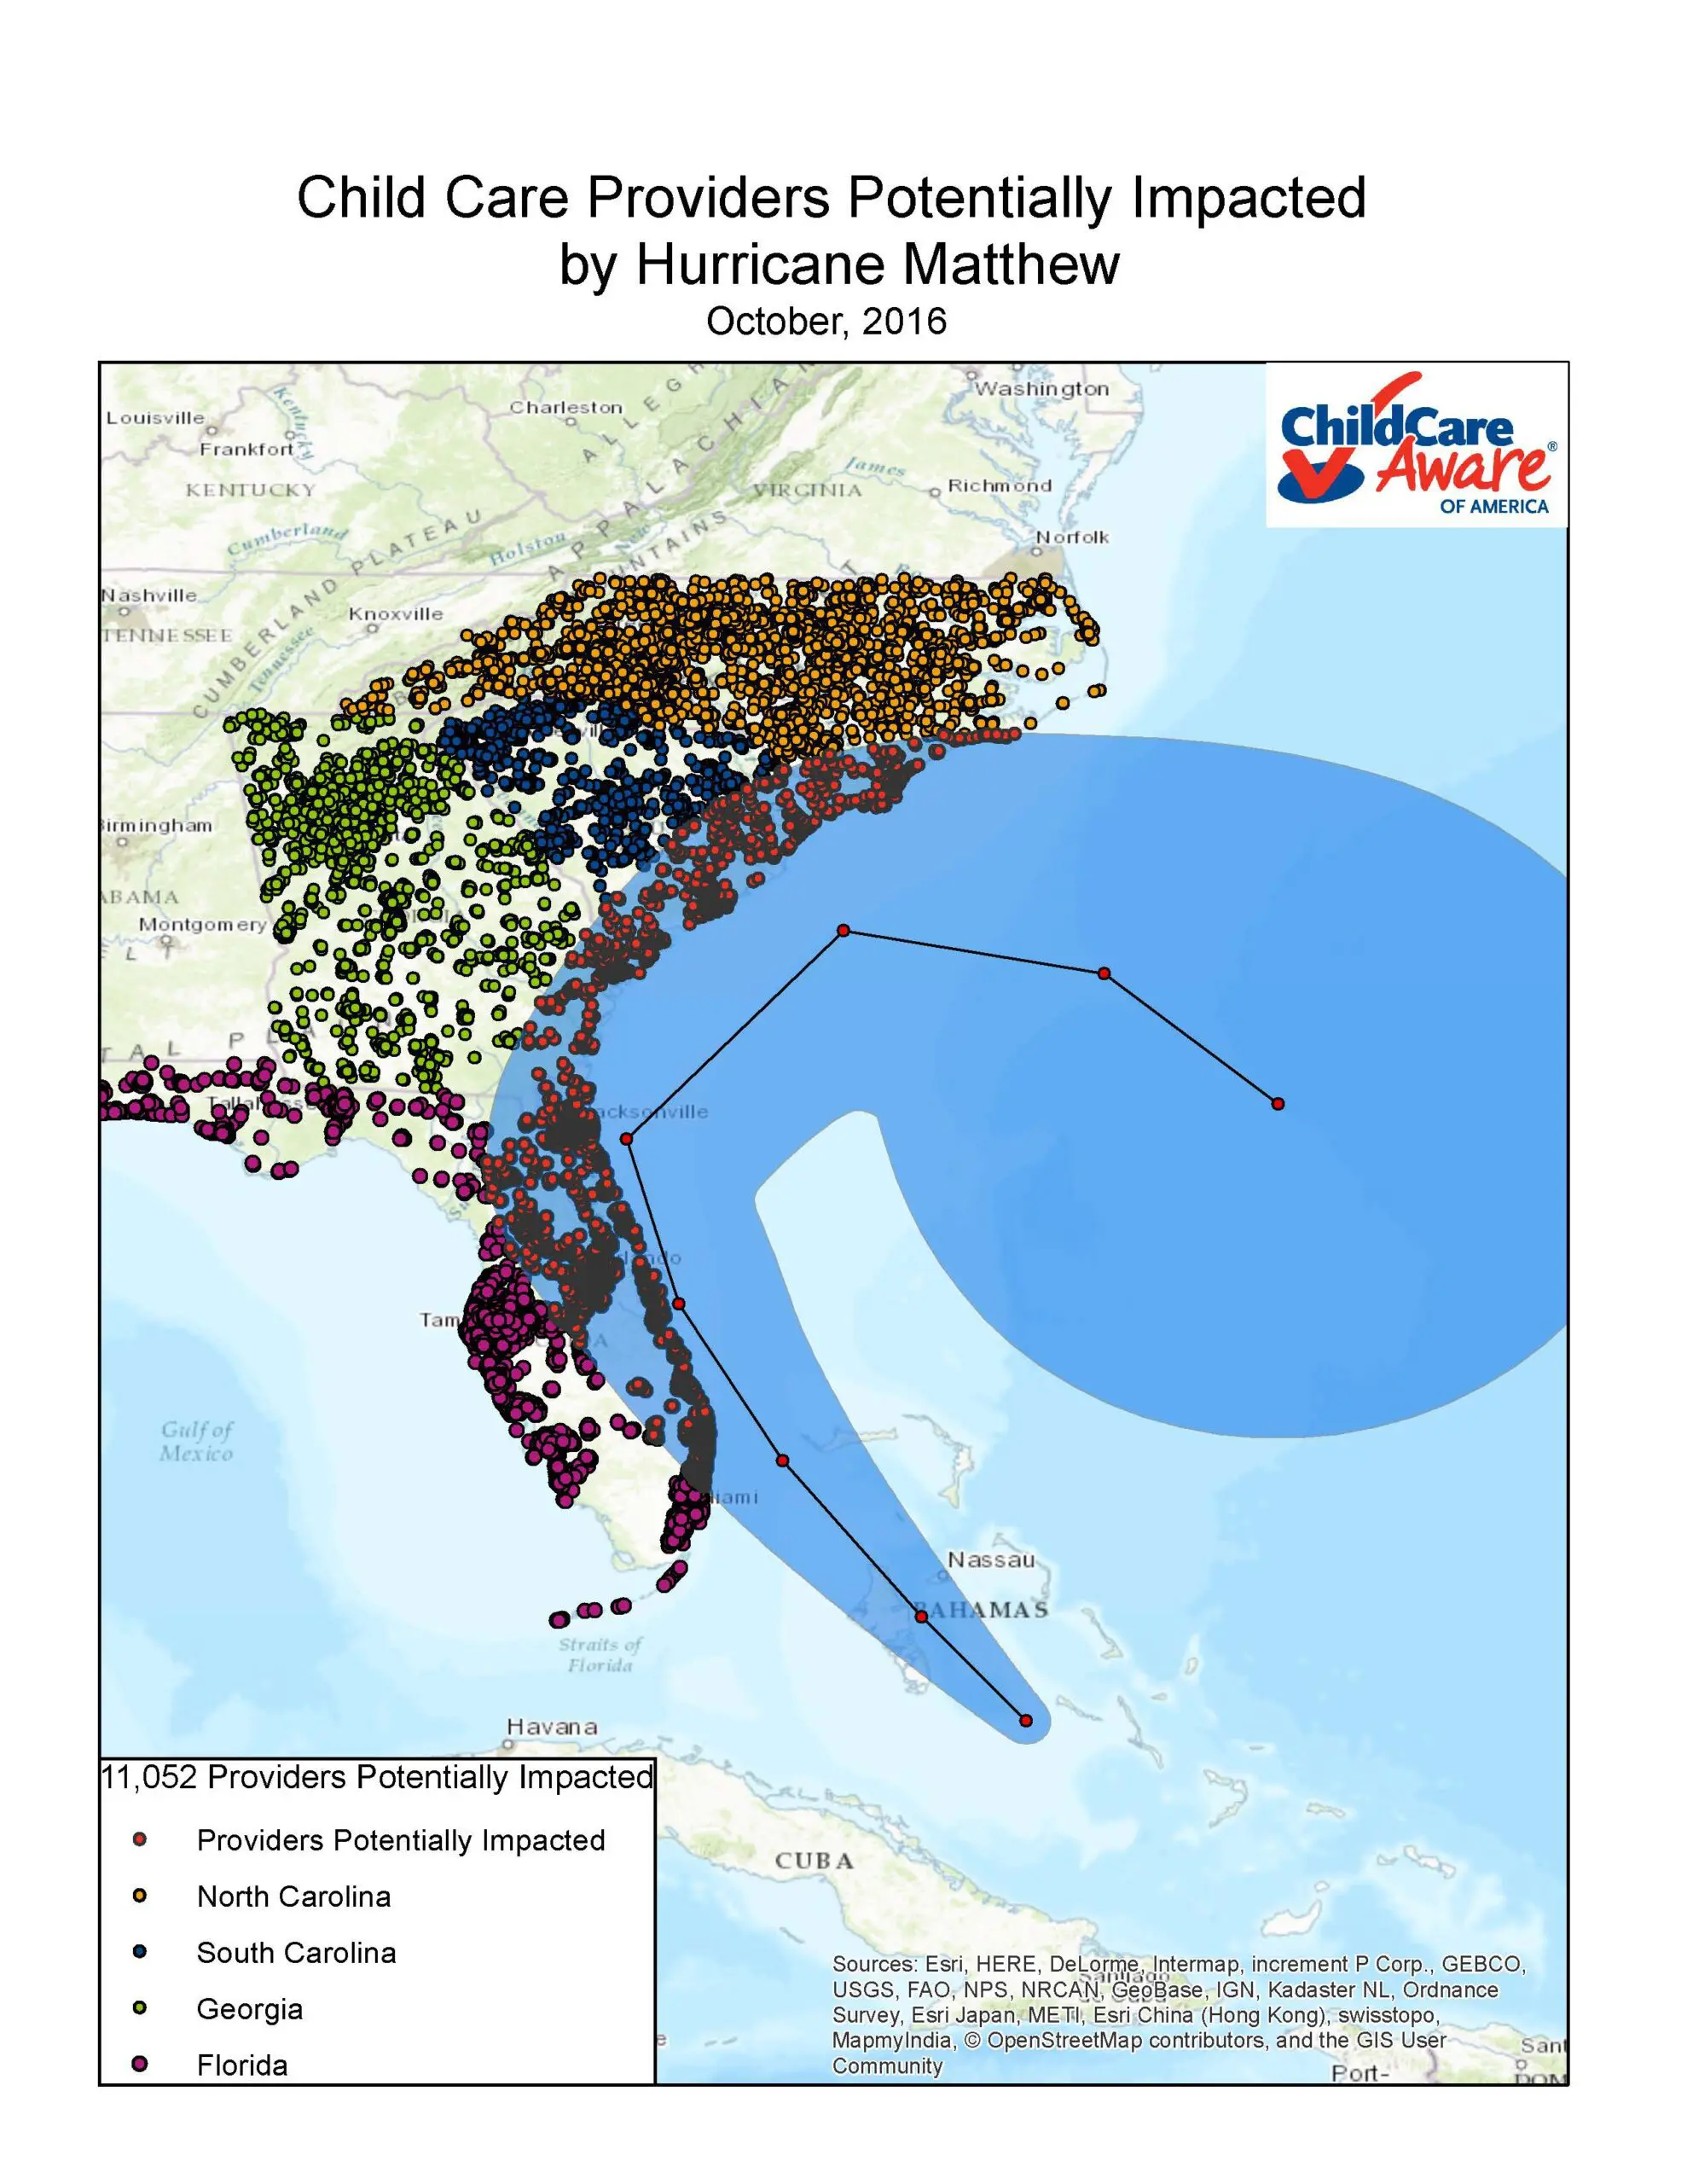
Hurricane Matthew Path
Highlighted are all of the various child care providers in Florida (purple), Georgia (green), South Carolina (blue), and North Carolina (yellow) as well as those potentially impacted (red), from the fore-mentioned states, that were in Hurricane Matthew’s path (light blue shading).
Monticello Power Plant
Highlighted are the various child care facilities (multi-colored dots) within a 10 mile radius (red shading) of the Monticello Power Plant (big black dot), as well as in the counties surrounding the area.

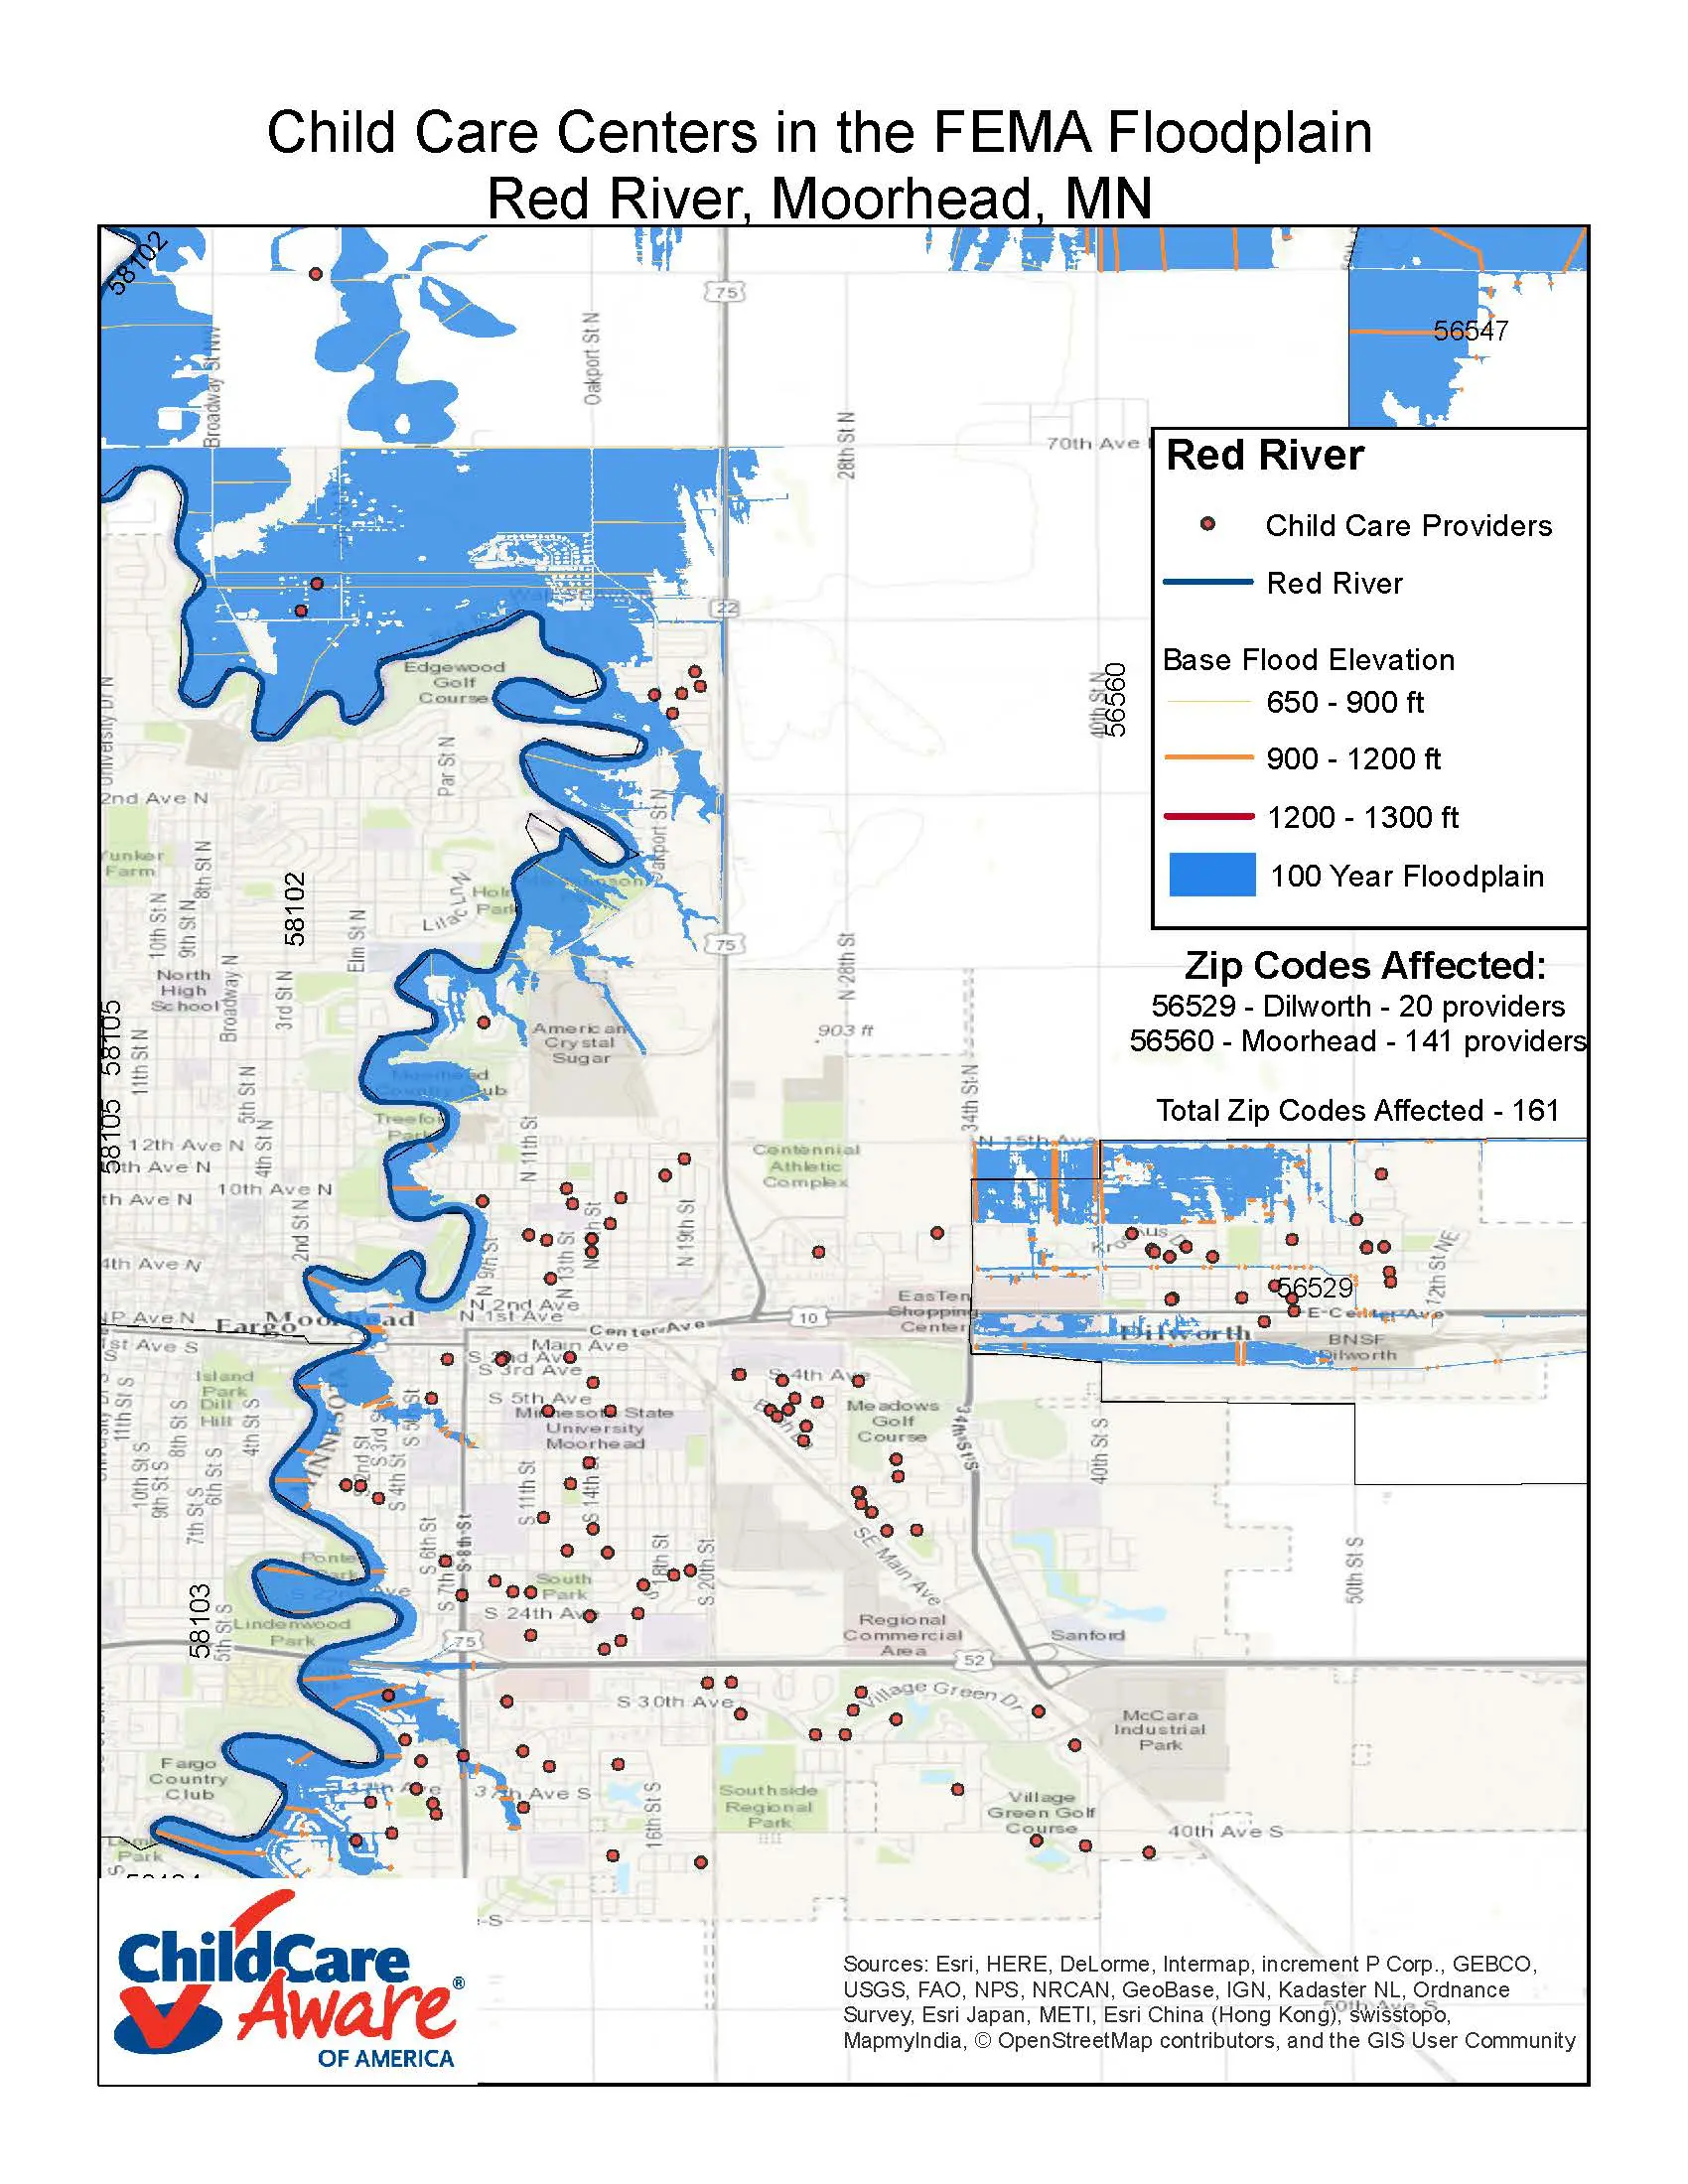
Red River Moorhead and Fargo
Detailed is the 100 year floodplain (light blue shading) of the Red River (dark blue line) in Moorhead, MN and the child care providers (red dots) in the area. The base flood elevation is highlighted (orange lines; categorized from lowest, thin and light colored, to highest levels, thick and dark colored) through the 100 year floodplain.