
Every family deserves access to affordable, high-quality child care—but too often, the reality falls far short. Child Care Aware® of America has led the field in identifying and mapping the gaps between the supply of and demand for child care. Through Mapping the Gap™, we established one of the first national resources to show families, advocates, and policymakers where child care deserts exist and how access differs across states and communities. This work laid the foundation for how the field talks about child care shortages and remains a go-to, easy-to-use resource for understanding the scope of the challenge.
These interactive story maps, this initiative layer together powerful data—licensed provider locations, capacity, participation in assistance programs like CCDF and CACFP, family poverty levels, food access, and more—to tell a vivid story about geographic disparities across states.
We are excited to partner with the Buffett Early Childhood Institute on their Child Care Assessment Gaps portal, which provides a more technical exploration of these data. While our Mapping the Gap™ portal provides clear, accessible insights and a historical view of child care access, BECI’s tool offers a more detailed, research-driven dive into current and emerging data. Together, these resources provide both the big picture and the finer detail—equipping families, policymakers, and advocates with the information they need to drive solutions.
Frequently Asked Questions
What is a story map?
A story map combines both maps and text to help users interpret what they are seeing. Each story map tells a unique story about access to child care programs in the states we have worked with. Our story maps layer information about child care provider location, child care supply and demand, participation in programs like CACFP and CCDF subsidy, food access, family poverty, and more.
How can I use this?
That’s up to you to decide! We encourage you to look at the data, play with the maps and consider some of the strategies for change or policy recommendations included in the maps. If you would like additional information or are interested in mapping the child care gaps in your state, let us know!
Mapping the Gap™
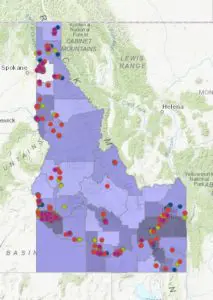
Mapping the Gap in Idaho. Check out this map for special analysis of child care supply and demand in Boise, ID—the fastest growing city in the United States.
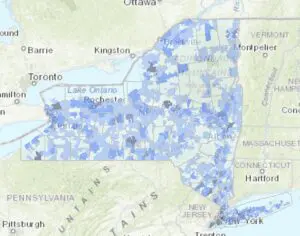
Mapping Infant-Toddler Gaps in New York. In New York, 70% of infants and toddlers don’t have access to licensed child care in their community.
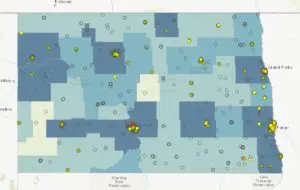
Mapping the Gap in North Dakota. Across North Dakota, only one-third of children under age 13 have access to licensed child care.
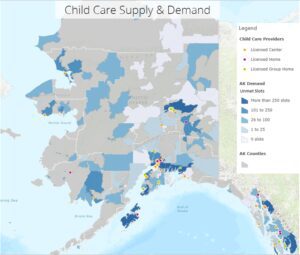
Mapping Infant-Toddler Gaps in Alaska. Only 18% of infants and toddlers (1 in 5) have access to licensed child care. Download a supplementary report.
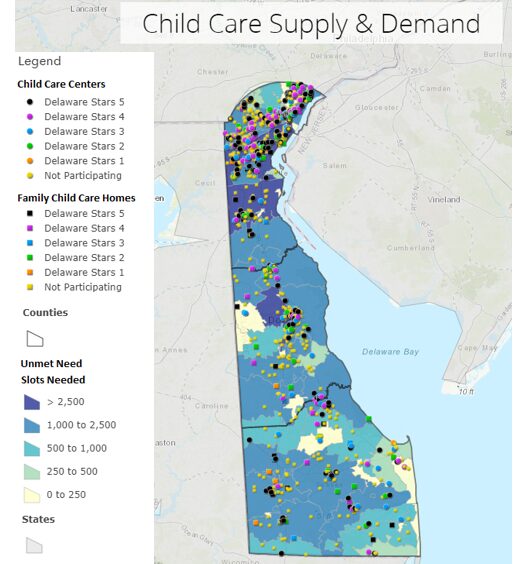
Mapping Infant-Toddler Gaps in Delaware. In the Wilmington, DE suburbs, 50% of infants and toddlers have access to licensed child care, even with increased child care programs. Download a supplementary report.
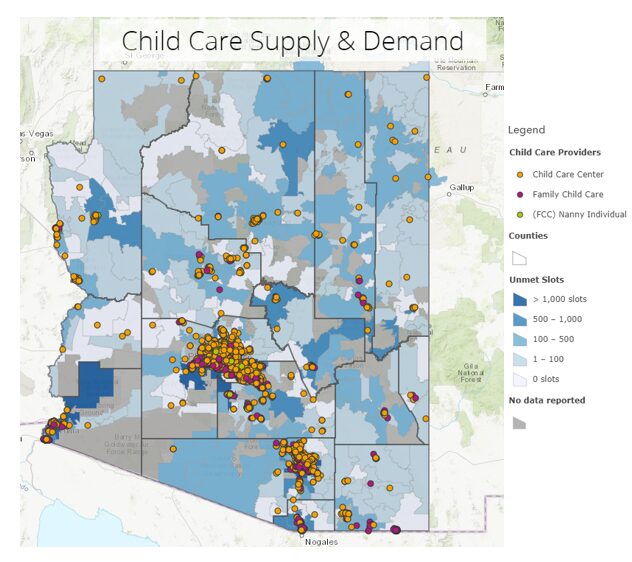
Mapping Infant-Toddler Gaps in Arizona. In Mohave County, AZ, only 7% of infants and toddlers have access to licensed child care. Download a supplementary report.
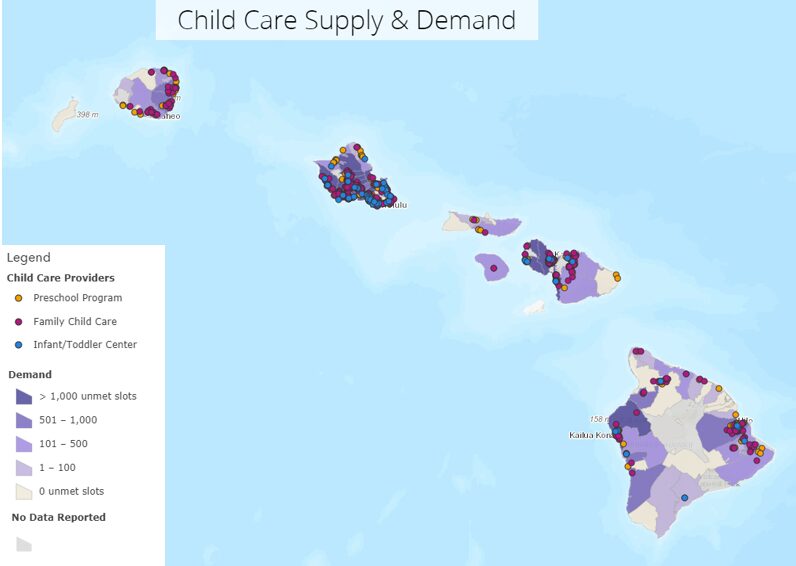
Mapping Infant-Toddler Gaps in Hawaii. Of the more than 35,000 licensed child care slots in Hawaii, only 11% are available to infants and toddlers. Download a supplementary report.
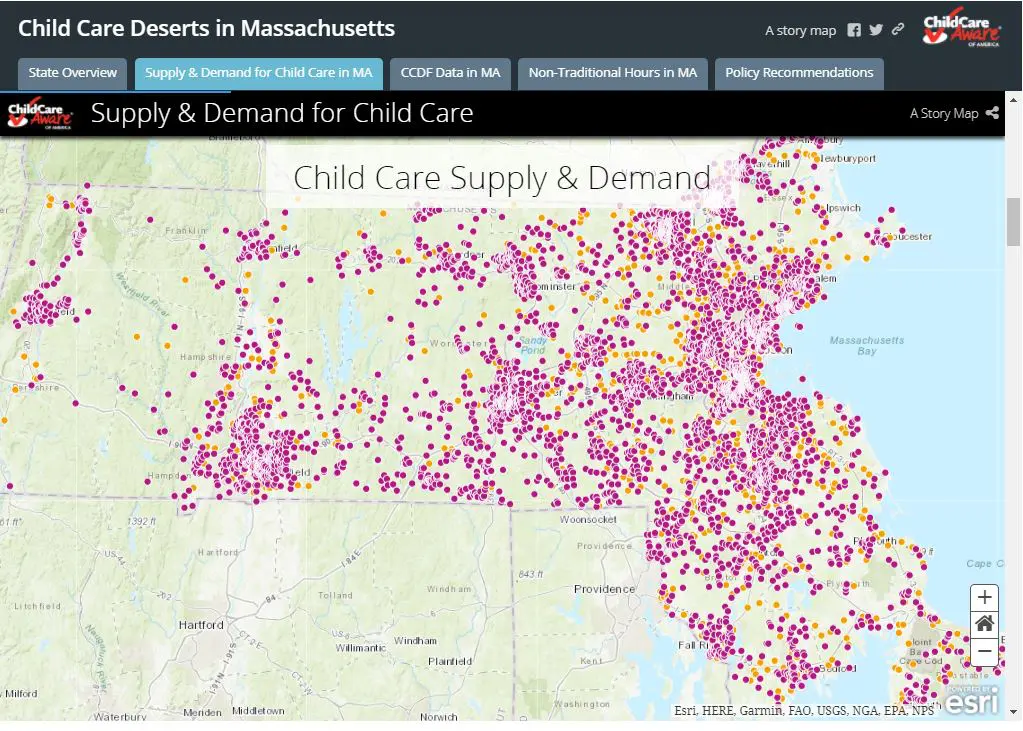
Mapping the Gap in Massachusetts. Working families in Massachusetts do not have access to licensed child care, particularly during nontraditional hours. Download a county-level supplement.
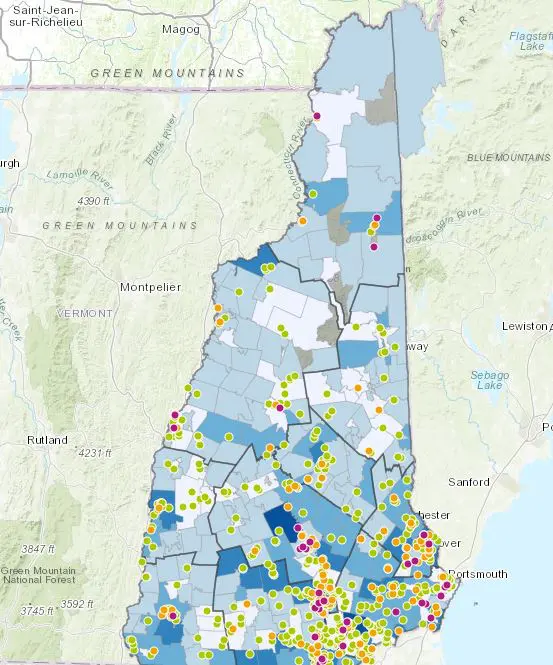
Mapping the Gap in New Hampshire. Two out of five children in working families in New Hampshire does not have access to licensed child care while their parents are at work. Download a county-level supplement. Download a supplementary report.
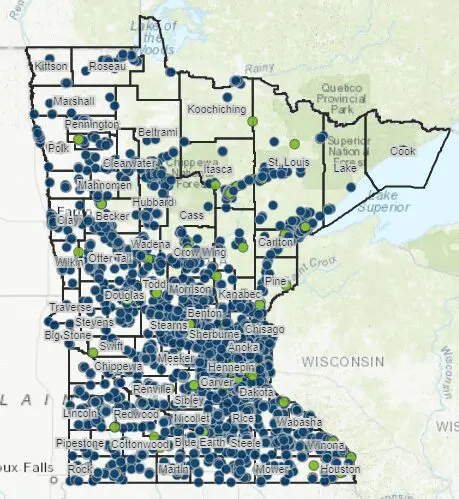
Mapping the Gap in Minnesota. Minnesota faces a child care deficit of more than 80,000 licensed child care slots. Download a county-level supplement.Download a supplementary report.
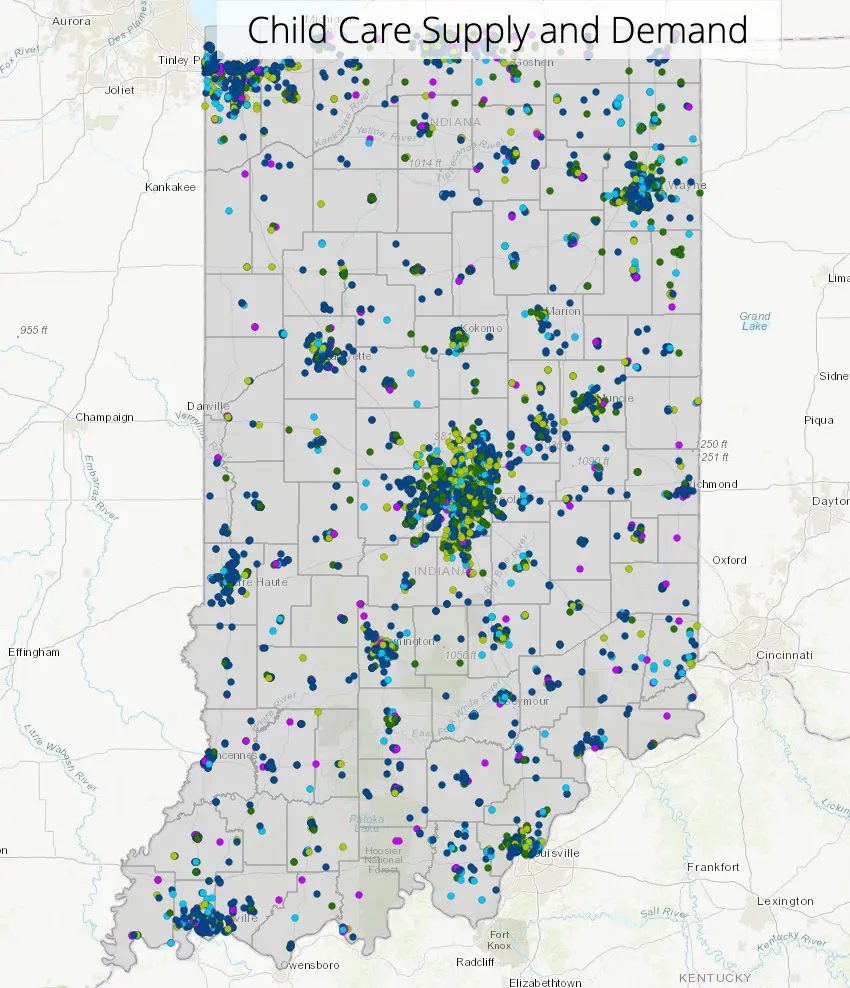
Mapping the Gap in Indiana. In the state of Indiana, there are approximately 327,173 children under 6 with all parents in the labor force. Additionally, there are 4,969 licensed child care providers, with the license capacity totaling 190,871. This leads to the deficit equaling 23,231 slots not available to compensate for all the children in that area. Download a supplementary report.
Interested in Mapping Your State?
Child Care Aware® of America is committed to partnering with states to support their work and help them meet CCDBG requirements. These innovative story maps influence national discussions about child care and can be used as a tool to advocate for high-quality, affordable child care. Contact us to learn more about state-based mapping opportunities.
Be advised, continued access on this page and/or its contents will be considered and potentially used in the future as acceptance of the terms and conditions of this disclaimer. Click here to review the terms.